Market Update + Q&A, January 2022

Market Update + Q&A, January 2022

See below for our January Market Update + Q&A. Summary points below the video.

Market Update & Q&A Video Summary (January 2022):

00:09 Disclaimer

01:41 Risk Indicators – Volatility 02:31 Risk Indicators – CDS Spreads

03:15 Risk Indicators – Bond Spreads

04:09 Velocity of Money

05:38 Trade Deficit

07:44 Margin Debt

11:28 Inflation – Transitory or Not?

25:27 Crypto Update – Protocol Revenue

27:37 Crypto Revenue in Perspective

28:49 Creator Economy

34:17 DeFi Q+A

36:03 Q: How would you use crypto as a currency – stable coins?

37:15 Q: Inflation, Labor, Supply Problems – building Cash in Positions

37:41 Q: Do you feel that emerging markets are underinvested?

39:10 Q: Where do you see the greatest risk in opportunities in the year ahead?

40:30 Q: In an unpredictable world do you bet on using cash positions to invest in growth stocks?

43:19 Q: Questions on various Stocks

To set up a meeting, please click here or give us a call.

Best regards,

The Willow Team
+1 413 236 2980

Willow Risk Monitor – December 2020

The Willow Risk Monitor July 2020
Willow Risk Monitor December 2020

Welcome to the December 2020 overview edition of the Willow Risk Monitor, where we share our analysis of the level of risk in the current market across a variety of metrics. We also explain our thinking on how we look at and assess overall market risk, and we will often highlight what the data shows compared to what you might be hearing in the news.

At Willow, risk management is one of our key influencers in creating portfolio strategies for our clients. We hope this gives a peek into our investment management window.

Consumer Health (proprietary algorithm)
consumer health for dec 2020

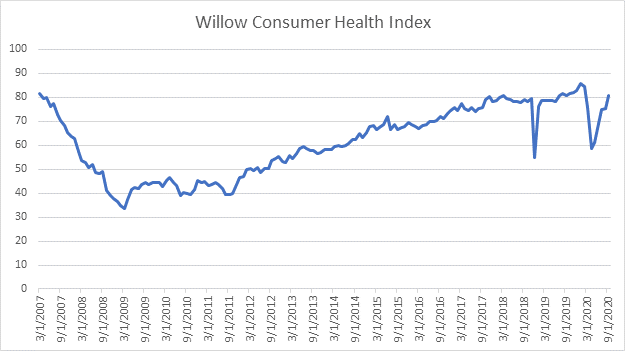
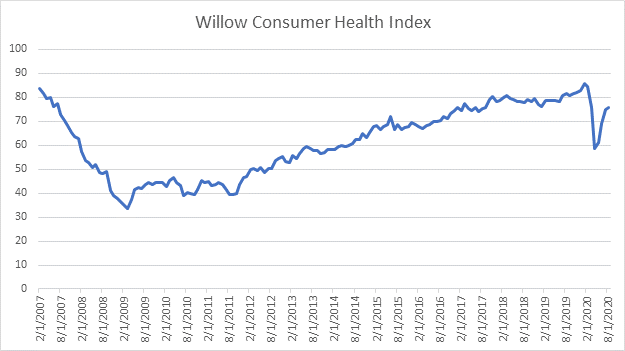
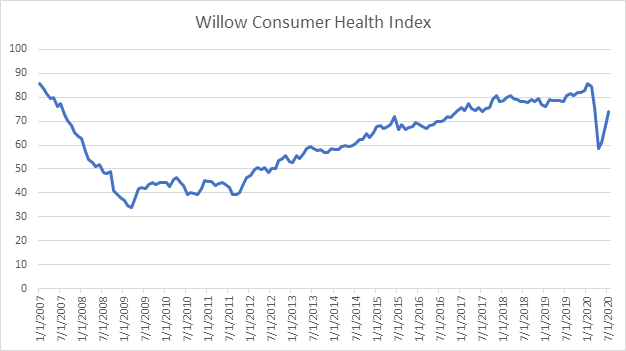
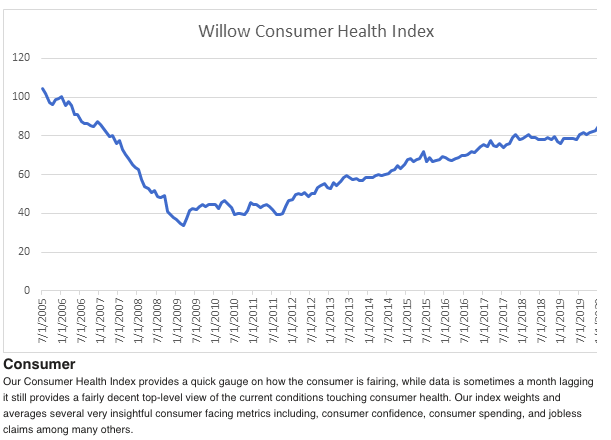
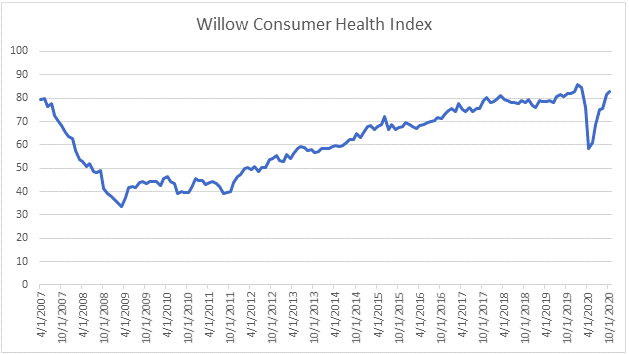
Again, overall, the metrics measuring consumer health continue to improve. What the above chart does not show is the reality for lower wage earners as they have a much lower impact on the data being collected to measure consumer health (home buying/building, retail sales, consumer credit, and confidence surveys tend to under represent lower wage earners).

Risk Assessment: Medium/Low

Manufacturing Health (proprietary algorithm)
manufacturing health dec 2020
how we look at manufacturing

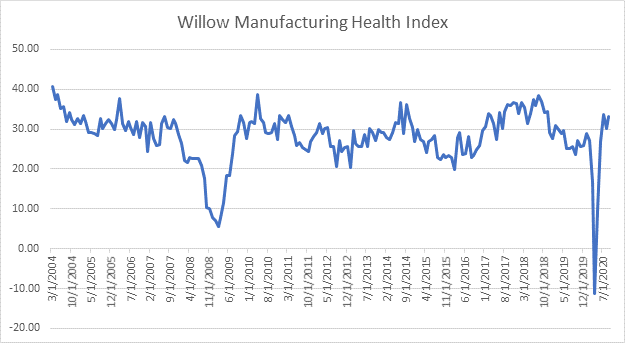
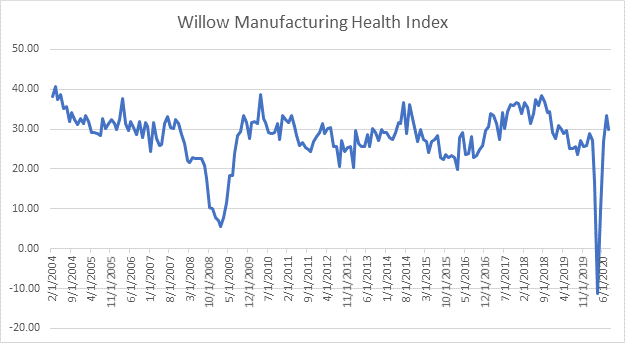
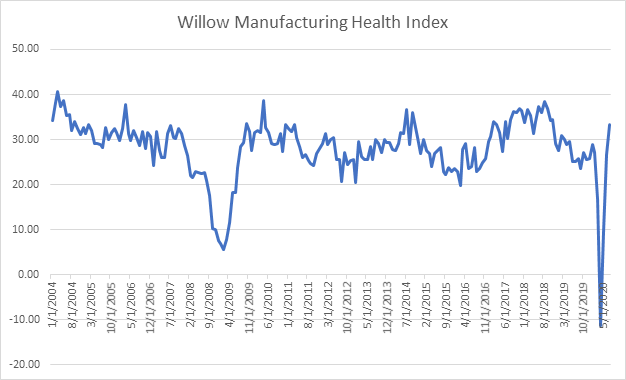
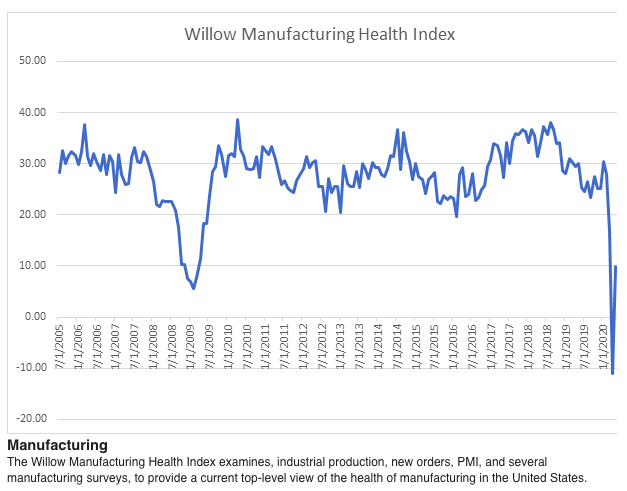
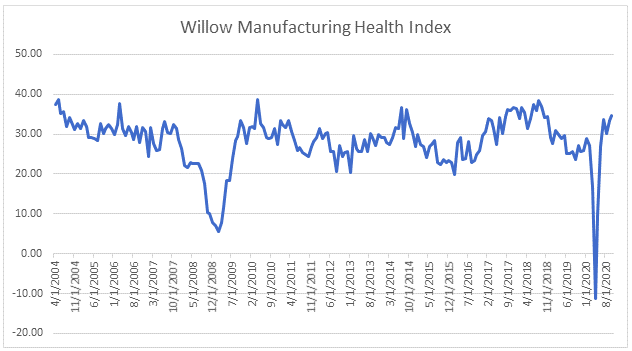
Removing February and March from this chart and you wouldn’t know the world fell into a health crisis that shook supply chains and is still wreaking havoc. Data here continues to come in pretty good or at least in line with the past decades average. 

Risk Assessment: Medium/Low

Market Volatility (proprietary algorithm)
volatility dec 2020

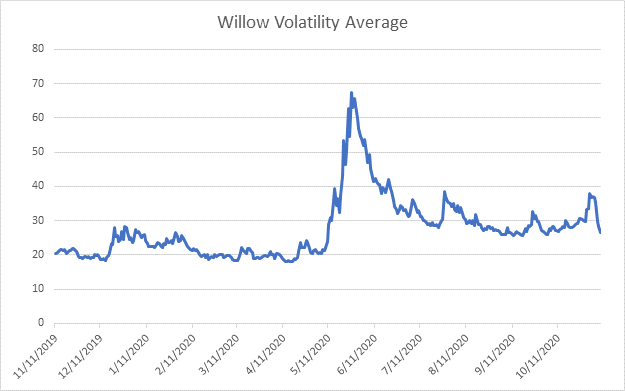
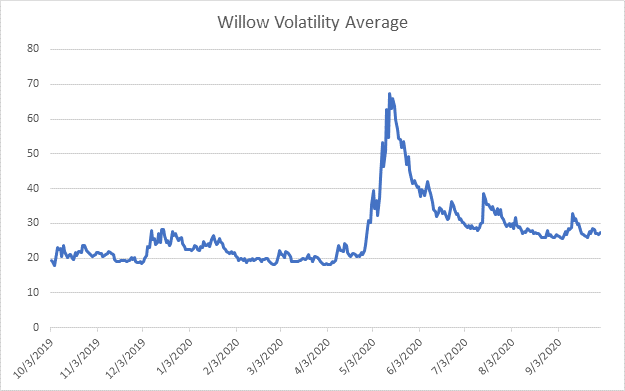
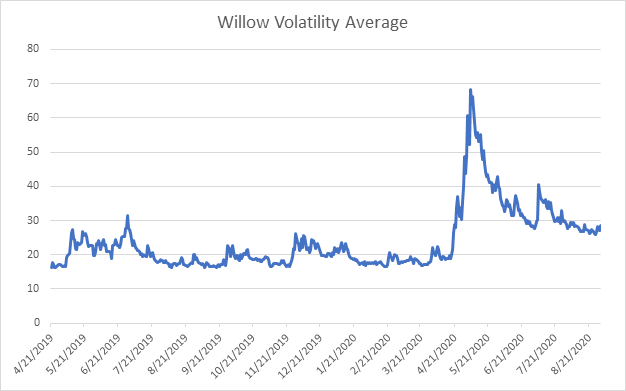
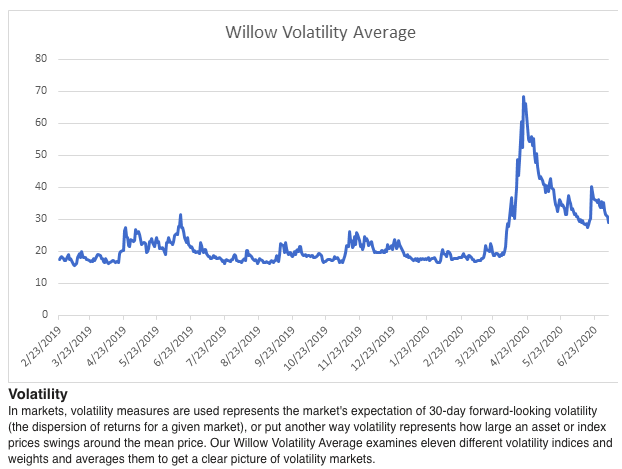
Volatility has come down considerably from its peak earlier in the year. While the trend is positive, the velocity, or rate of change, has slowed significantly. Markets are pricing in volatility risk higher than at the start of the year but in relative terms not by that much.

Risk Assessment: Medium/Low

Credit Default Swaps
credit default swaps dec 2020
how we look at CDS

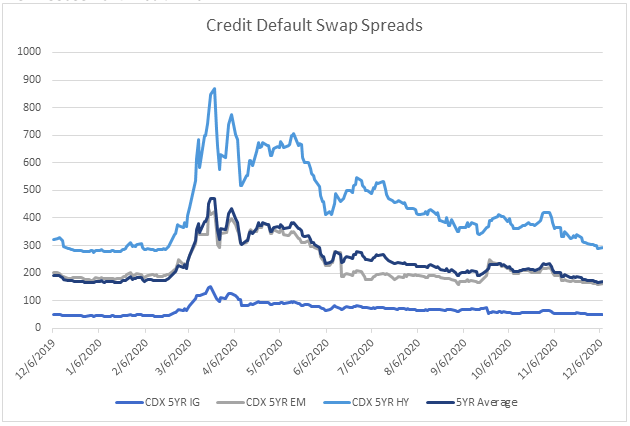
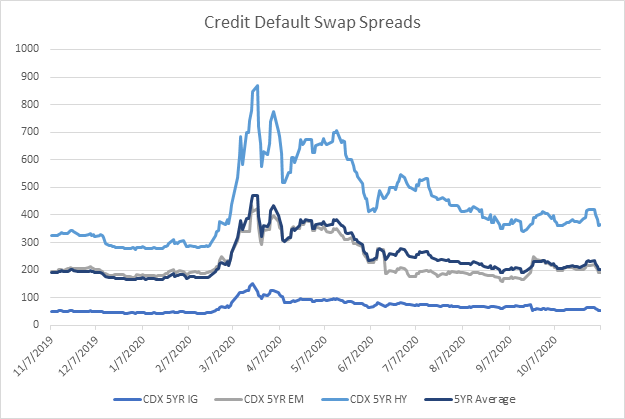
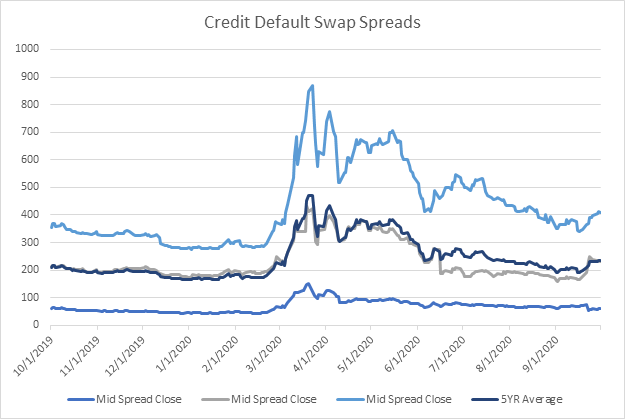
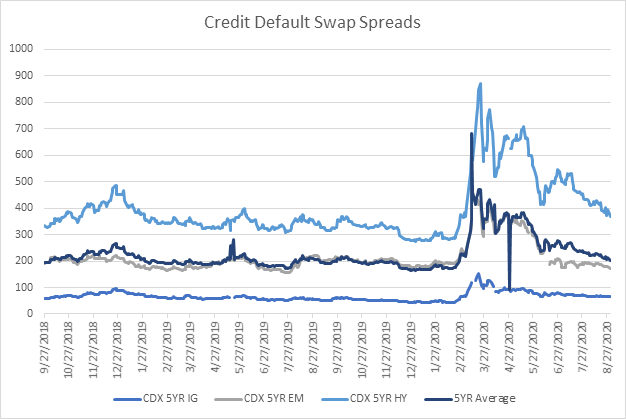
Not much has changed here since last month. CDS spreads, the cost of credit protection, have had a bumpy ride but spreads have mainly returned to pre-COVID levels. Credit protection isn’t cheap but it isn’t expensive either.

Risk Assessment: Low

Bond Spreads
bond spreads dec 2020
how we look at bonds

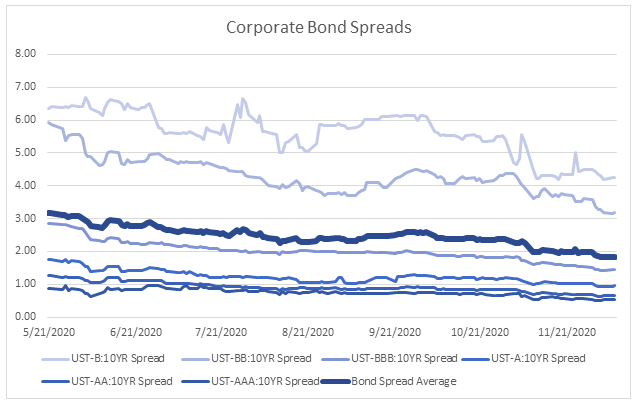
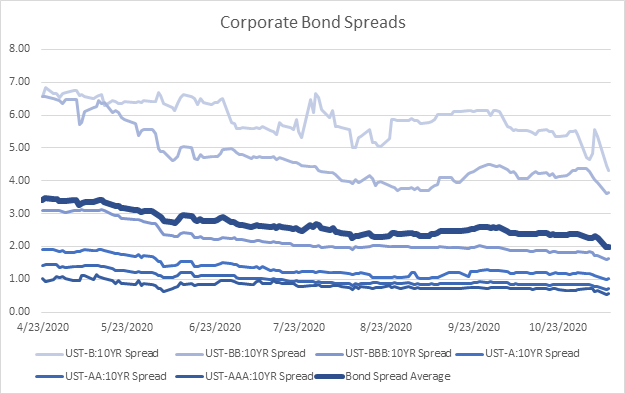
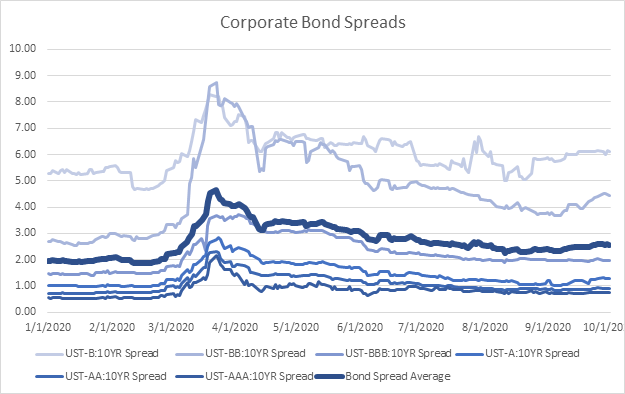
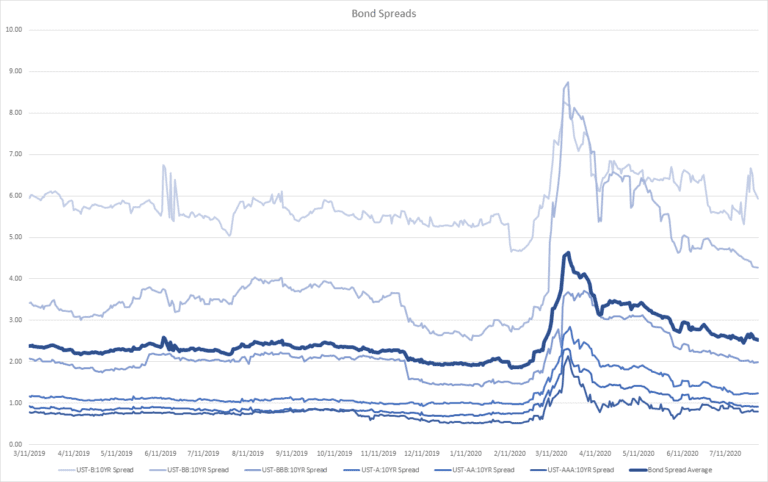
Overall bond spreads have continued to tighten in aggregate signaling lower perceived risk in the debt markets. Worth noting is the highest tier of credit we monitor (AAA) and the much riskier BBB tier have both basically flatlined for the past month.

Risk Assessment: Low

As always, be well and please feel free to reach out with any questions, comments or concerns.

Best regards,

The Willow Team
+1 413 236 2980
ADCM, LLC dba Willow does not provide tax, legal, or accounting advice. This material has been prepared for informational purposes only, and is not intended to provide, and should not be relied on for, tax, legal or accounting advice. You should consult your own tax, legal and accounting advisors before engaging in any transaction. Although the information contained herein has been obtained from sources believed to be reliable, its accuracy and completeness cannot be guaranteed.  Neither the information nor any opinion expressed herein constitutes an offer or a solicitation of an offer to buy or sell securities.  

Willow Risk Monitor – November 2020

The Willow Risk Monitor July 2020
Willow Risk Monitor November 2020

Welcome to the November 2020 overview edition of the Willow Risk Monitor, where we share our analysis of the level of risk in the current market across a variety of metrics. We also explain our thinking on how we look at and assess overall market risk, and we will often highlight what the data shows compared to what you might be hearing in the news.

At Willow, risk management is one of our key influencers in creating portfolio strategies for our clients. We hope this gives a peek into our investment management window.

Consumer Health (proprietary algorithm)

Metrics measuring consumer health continue to improve. The gap between high and low wage earnings continues to widen which, while we see much of the data as promising, still gives us pause.

Risk Assessment: Medium/Low

Manufacturing Health (proprietary algorithm)
how we look at manufacturing

Our manufacturing health index is back to pre-covid levels, but we still reserve some caution here as supply chains have been massively disrupted and global trade is still sorting itself.

Risk Assessment: Medium/Low

Market Volatility (proprietary algorithm)

While volatility has pulled back after a recent spike levels are still elevated vs the longer term. Many unknowns are still keeping risk premiums higher – the election transition, vaccines, COVID, geopolitics, global trade, changing demographics, climate, the list goes on…

Risk Assessment: Medium

Credit Default Swaps
how we look at CDS

CDS spreads show an easy way to gauge the cost of credit protection.  While it’s been a bumpy ride, spreads have mainly returned to pre-COVID levels, having the FED as a credit market backstop definitely helps.

Risk Assessment: Low

Bond Spreads
how we look at bonds

Bond spreads continue to tighten signaling lower perceived risk in the debt markets.

Risk Assessment: Low

As always, be well and please feel free to reach out with any questions, comments or concerns.

Best regards,

The Willow Team
+1 413 236 2980
ADCM, LLC dba Willow does not provide tax, legal, or accounting advice. This material has been prepared for informational purposes only, and is not intended to provide, and should not be relied on for, tax, legal or accounting advice. You should consult your own tax, legal and accounting advisors before engaging in any transaction. Although the information contained herein has been obtained from sources believed to be reliable, its accuracy and completeness cannot be guaranteed.  Neither the information nor any opinion expressed herein constitutes an offer or a solicitation of an offer to buy or sell securities.  

Willow Risk Monitor – October 2020

The Willow Risk Monitor July 2020
Willow Risk Monitor October 2020

Welcome to the October 2020 overview edition of the Willow Risk Monitor, where we share our analysis of the level of risk in the current market across a variety of metrics. We also explain our thinking on how we look at and assess overall market risk, and we will often highlight what the data shows compared to what you might be hearing in the news.

At Willow, risk management is one of our key influencers in creating portfolio strategies for our clients. We hope this gives a peek into our investment management window.

Consumer Health (proprietary algorithm)

Coming off the forced shut down, high wage earners (those making over $60k/yr) employment levels are almost back to pre-COVID levels (-12% to -1%, from April to September) while low wage workers (those making under $27k/yr)  have only recovered half as much (-36% to -16%, from April to September). Arguably this cohort has less spending power, so even though the facts on the ground are sobering the economic impact is lessened. Unemployment claims have leveled off in the 800k range (which is still round 4x the average). But consumer sentiment, expectations, and spending have been rising steadily, home sales have been strong, and productivity has jumped – all positive tail winds. 

Risk Assessment: Medium/Low

Manufacturing Health (proprietary algorithm)
how we look at manufacturing

Our manufacturing health index is back to pre-covid levels, but we still reserve some caution here. Forced shutdowns in the manufacturing sector have been generally lifted so numbers should continue to come in strong in response as pent up demand releases.  Many manufacturing based indicators are at or above pre-COVID levels (business confidence, durable goods, and most regional manufacturing indices), industrial production has lagged but new orders continue to rise.

Risk Assessment: Low

Market Volatility (proprietary algorithm)

Volatility (the implied forward-looking move in markets) bottomed out in August and has slowly been creeping back up. This is most likely due to election jitters. 

Risk Assessment: Medium

Credit Default Swaps
how we look at CDS

Credit default swap spread have been rising. This is worth paying attention to as it signals that credit protection is getting more expensive. This happens when the perception shifts to believe that the underlying companies are more risky, more likely to default, or more likely to not meet their debt obligations going forward. While not extraordinarily high, levels have been rising since August and have yet to return to pre-2020 levels.

Risk Assessment: Medium

Bond Spreads
how we look at bonds

Corporate bond spreads have been widening slightly. Most notable are the moves in A rated and BB rated corporate bonds which have pushed the average spread higher. Again, the higher the spreads the higher perceived risk in the underlying companies issuing the bonds. As these are investment grades that have their spreads widening it is worth noting. One reason could be the recent uptick in furloughs and layoffs.

Risk Assessment: Medium/Low

As always, be well and please feel free to reach out with any questions, comments or concerns.

Best regards,

The Willow Team
+1 413 236 2980
ADCM, LLC dba Willow does not provide tax, legal, or accounting advice. This material has been prepared for informational purposes only, and is not intended to provide, and should not be relied on for, tax, legal or accounting advice. You should consult your own tax, legal and accounting advisors before engaging in any transaction. Although the information contained herein has been obtained from sources believed to be reliable, its accuracy and completeness cannot be guaranteed.  Neither the information nor any opinion expressed herein constitutes an offer or a solicitation of an offer to buy or sell securities.  

Willow Risk Monitor – Sept 2020

The Willow Risk Monitor July 2020
Willow Risk Monitor September 2020

Welcome to the September 2020 overview edition of the Willow Risk Monitor, where we share our analysis of the level of risk in the current market across a variety of metrics. We also explain our thinking on how we look at and assess overall market risk, and we will often highlight what the data shows compared to what you might be hearing in the news.

Please contact us if you have any questions or if there is something you’d like more detail about. We welcome your feedback!

To learn more about the premium version of the Willow Risk Monitor, click here.

Consumer Health (proprietary algorithm)
looking at consumer health

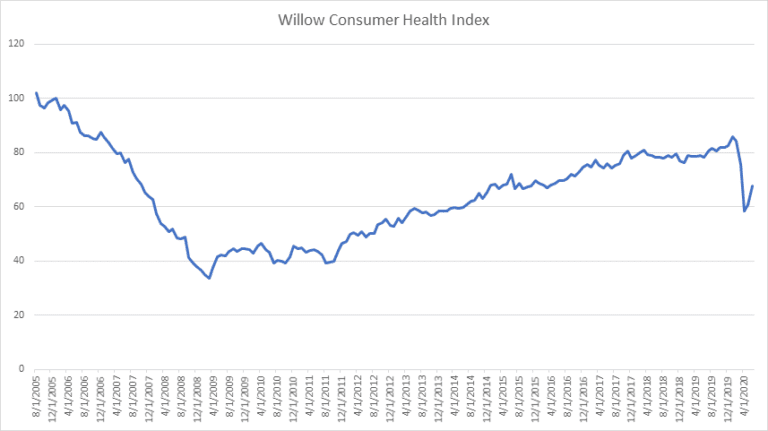
Our Consumer Health Index included several metrics focused on consumer sentiment and confidence, which have rebounded from their lows but have not yet been able to catch up to pre-COVID levels.  While markets have a direct impact on consumer confidence, along with housing data (which for individuals out of cities has been fantastic), high levels of unemployment, wage stagnation, and uncertainty around the election and if a second COVID wave will materialize have continued to weigh this index down.

Manufacturing Health (proprietary algorithm)
looking at manufacturing
how we look at manufacturing

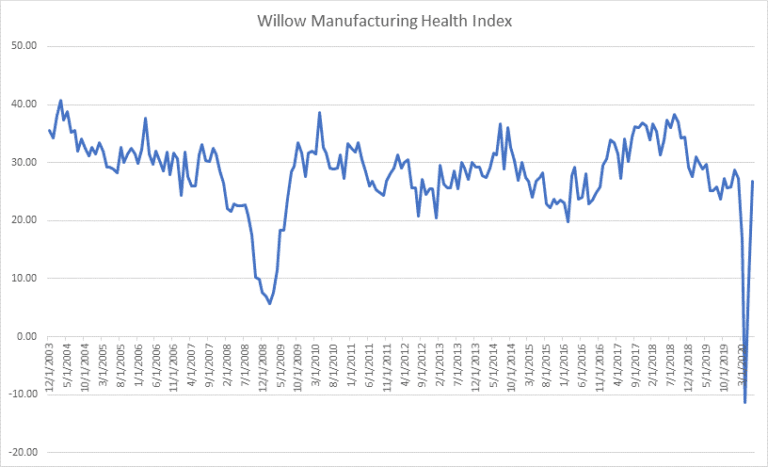
The rebound continues in the manufacturing space, and our indicators are showing a fast paced return to the mean. The degree of steepness in both drop and “recovery” makes sense when viewed through the lens that this was due to an intentional shut down of the economy and not due to outright structural issues (though those are still very much present) in manufacturing. Cost cutting, restructuring, increased automation all plays a role here. Overall, it is a positive sign, for now.

Market Volatility (proprietary algorithm)
looking at volatility

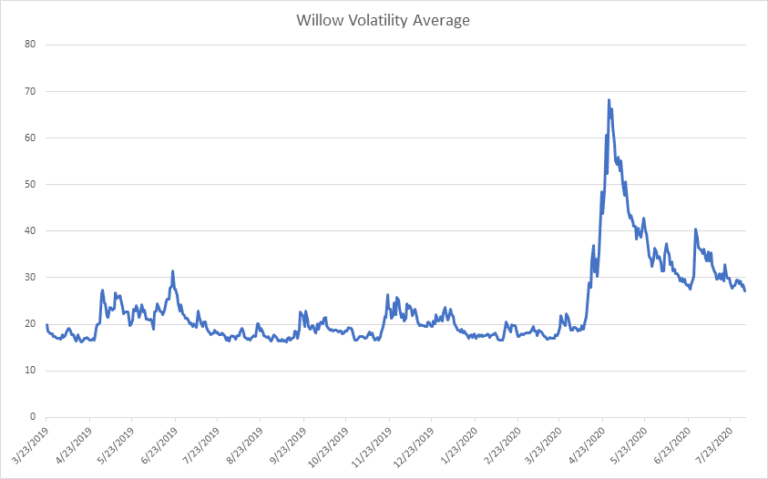
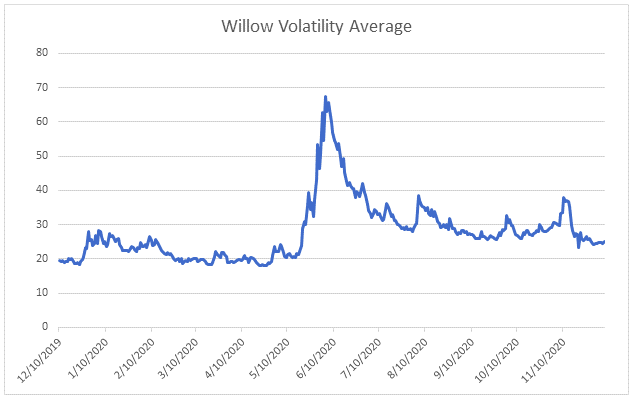
Our Willow Volatility Average examines several indices that track volatility, or the implied moves in asset prices over the next thirty days. Just recently this index has started to tick up. With the election looming, schools reopening, geopolitical tension rising, traders returning from vacation, and overall uncertainty on rise, especially around policy, it makes sense that this indicator would start flashing. While way off its March highs, our Volatility Average has been relatively flat for the past month but remains at a historically elevated level. The recent up-tick has us paying attention.

Credit Default Swaps
looking at credit default swaps
how we look at CDS

Credit default swap spreads have, for the most part, tightened back to pre-COVID levels which indicates markets believe the risk of defaults has come down considerably. High yield credit default swaps which shine a light on more riskier companies remains elevated still, but no where near its March peak.der the spread between it and its US Treasury counterpart. While overall most of these spreads have returned to pre-COVID levels, they still remain slightly elevated and may be starting to rise in some areas.

Bond Spreads
looking at bond spreads
how we look at bonds

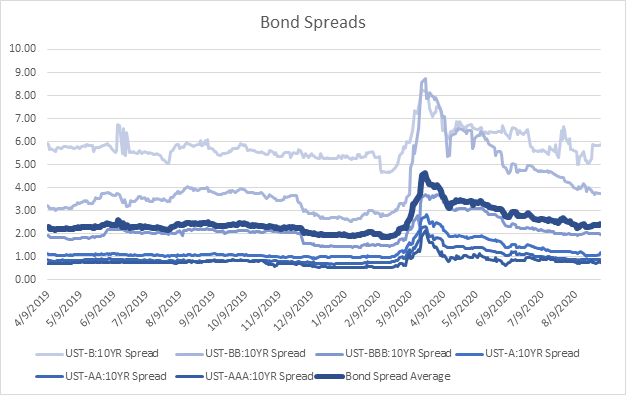
We look at bond spreads (the difference in interest rates between “risk free” or US Government bonds and different grades of corporate bonds) to show us how markets are gauging risk in lending to corporations. The riskier a bond is the wider the spread between it and its US Treasury counterpart. While overall most of these spreads have returned to pre-COVID levels, they still remain slightly elevated and may be starting to rise in some areas.

As always, be well and please feel free to reach out with any questions, comments or concerns.

Best regards,

The Willow Team
+1 413 236 2980

ADCM, LLC dba Willow does not provide tax, legal, or accounting advice. This material has been prepared for informational purposes only, and is not intended to provide, and should not be relied on for, tax, legal or accounting advice. You should consult your own tax, legal and accounting advisors before engaging in any transaction. Although the information contained herein has been obtained from sources believed to be reliable, its accuracy and completeness cannot be guaranteed.  Neither the information nor any opinion expressed herein constitutes an offer or a solicitation of an offer to buy or sell securities.  

Willow Risk Monitor – Aug 2020

The Willow Risk Monitor July 2020
Willow Risk Monitor August 2020

Welcome to the August 2020 overview edition of the Willow Risk Monitor, where we share our analysis of the level of risk in the current market across a variety of metrics. We also explain our thinking on how we look at and assess overall market risk, and we will often highlight what the data shows compared to what you might be hearing in the news.

Please contact us if you have any questions or if there is something you’d like more detail about. We welcome your feedback!

To learn more about the premium version of the Willow Risk Monitor, click here.

Consumer Health (proprietary algorithm)
looking at consumer health

While there clearly was a rebound from the lows, our indicators are pointing to a “recovery” that is not nearly as strong as main stream news would have you believe. This is mostly due to a lack of recovery in metrics tracking consumer confidence and a leveling of unemployment data at high levels than expected.especially small businesses, are not expecting to rehire everyone they lost.

Manufacturing Health (proprietary algorithm)
looking at manufacturing
how we look at manufacturing

While the bounce back in manufacturing looks impressive and as if there has been a return to normal, it’s important to dig into the data on this one. As expected, prints on manufacturing data that took a huge hit in March have rebounded sharply. But when looking at the individual metrics, capacity utilization is lagging in a noticeable way. We believe this will take some time to play out but the reduction in capacity utilization (which tracks the amount of national production capacity that is currently being used) will begin impacting things like factory orders, this data can take some time to show up. We recommend watching this closely to see how broad the recovery actually is, and if the big number rebound prints where just the natural response to the preceding massive drop off.increased automation… the list of items poking this sector is long…

Market Volatility (proprietary algorithm)
looking at volatility

Volatility, or the implied move in market prices for the next 30 days has found a support level in our Willow Volatility Average chart around the 27-29 level. A break lower would signify less implied risk in markets, while a move high, the opposite. We consider this a key area to watch as since April, volatility has tightened at a rapid pace but has appeared to bottom out since June.   Again, we value the velocity of the curve more than the actual number and this curve is telling us that uncertainty remains.

Bond Spreads
looking at bond spreads
how we look at bonds

Overall bond spreads have tightened which is in general a sign of lower overall risk. While early, and potentially still forming, what is noteworthy this month is that on the investment grade side, spreads have flattened and returned to pre-corona virus levels. At the same time high yield bond spreads still remain elevated comparatively. What does it mean? There are a few conclusions that can be drawn:

Investment grade bond markets believe that having backing of the Federal Reserve removes a large portion of risk from this tranche, and;
High yield bonds, while receiving some support from the Fed, are still more prone to bankruptcies, which is why spreads remain elevated compared to longer term averages.

Watch the investment grade bond spreads side closely – while levels have flattened, small upticks in A rated bonds may be signaling concerns over bankruptcies impacting these bonds.

As always, be well and please feel free to reach out with any questions, comments or concerns.

Best regards,

The Willow Team
+1 413 236 2980
ADCM, LLC dba Willow does not provide tax, legal, or accounting advice. This material has been prepared for informational purposes only, and is not intended to provide, and should not be relied on for, tax, legal or accounting advice. You should consult your own tax, legal and accounting advisors before engaging in any transaction. Although the information contained herein has been obtained from sources believed to be reliable, its accuracy and completeness cannot be guaranteed.  Neither the information nor any opinion expressed herein constitutes an offer or a solicitation of an offer to buy or sell securities.  

Willow Risk Monitor – July 2020

The Willow Risk Monitor July 2020
Willow Risk Monitor July 2020

Welcome to the July 2020 overview edition of the Willow Risk Monitor, where we share our analysis of the level of risk in the current market across a variety of metrics. We also explain our thinking on how we look at and assess overall market risk, and we will often highlight what the data shows compared to what you might be hearing in the news.

Please contact us if you have any questions or if there is something you’d like more detail about. We welcome your feedback!

To learn more about the premium version of the Willow Risk Monitor, click here.

Consumer Health (proprietary algorithm)
Willow Consumer Health July 2020

The good news is, for now, it looks like a bottom has been found. Many of the individual data points are starting to turn positive or at least the velocity (the steepness of the curve) has leveled out and we’re seeing some flattening. An interesting take away here is the changes occurring in consumer credit, Americans have shifted in a big way to savings – with consumer credit outstanding dropping massively, it will be important to see if this rebounds as lock downs ease, or if a fundamental shift has taken place altering consumer spending patterns on a more permanent basis.

Risk Assessment: High. While things for many are uncertain, Government benefits have undoubtedly eased the pain but their continuation is not guaranteed and is set to change the end of this month. Millions are still jobless and while some jobs are coming back many, especially small businesses, are not expecting to rehire everyone they lost.

Manufacturing Health (proprietary algorithm)
Willow Manufacturing Health July 2020

While steepness of the “recovery” here is worth noting, it should be taken with a grain of salt. It looks to be mostly driven by a huge increase in PMI (the Purchasing Manager Index) which is based on a monthly survey of supply chain managers. There seems to be a lot of hope baked into this rise but in looking at other components of the manufacturing sector many metrics have flattened or only slightly risen from their bottom.

Risk Assessment: High. The pop-up from the bottom is great to see and definitely a positive but there is not enough data yet show this sector of the economy is out of the woods. To compound things, trade deals, trade wars, supply chain disruptions, increased automation… the list of items poking this sector is long…

Market Volatility (proprietary algorithm)
Willow Volatility Average July 2020

While volatility has come down considerably from its March peak, levels still remain elevated across the board. The direction is certainly positive, but the velocity has slowed, and the sustained higher-than-average levels warrant the need for caution.

Risk assessment: Medium.

Credit Default Swap Spreads
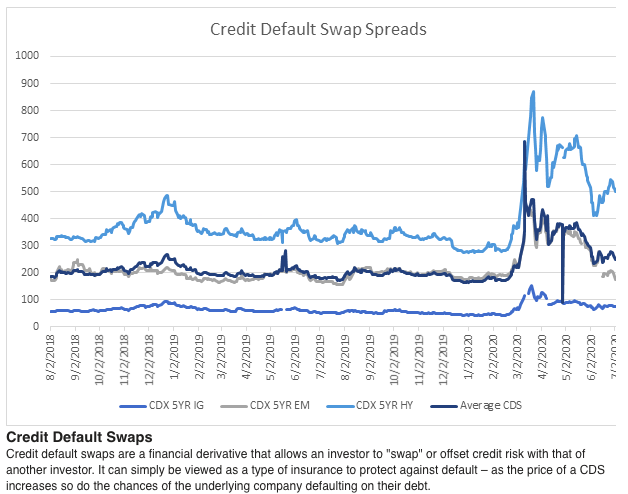
Credit Default Swaps Spreads July 2020

CDS Levels have remained elevated but continue to track down, which is positive. What keeps us watchful is that this tightening is mostly likely the result of government intervention, injecting capitol into companies to prevent defaults. But for now, the direction is right, and the levels seem to be normalizing here. Worth understanding though is that at these levels we would expect to and are seeing some bankruptcies to start trickling in.

Risk assessment: Medium.

Bond Spreads
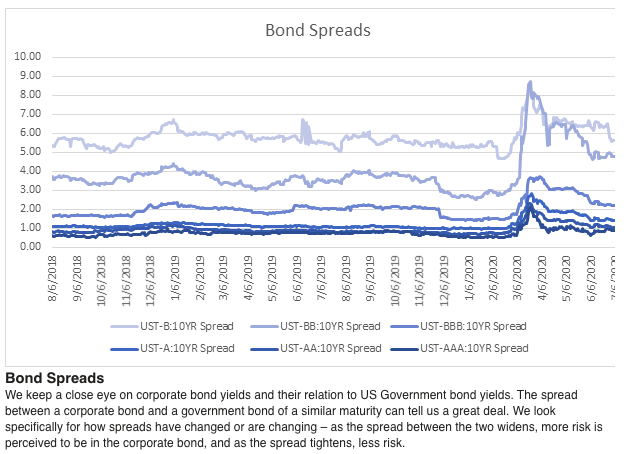
Bond Spreads July 2020

Things have settled down, and almost completely returned to normal for top rated investment grade companies. Higher yield or junk bonds spreads, while tightening some, are still wide – meaning risk in these markets is still very much alive.

Risk Assessment: Medium/Low. Actions of the Fed have taken some of the pressure off debt markets as they expands their balance sheets with bond ETF purchases and the purchase of actual bonds from individual companies. While we believe there are some very apparent conflicts of interest here and questionable ethics are taking place, these moves have stabilized these markets for time being.

As always, be well and please feel free to reach out with any questions, comments or concerns.

Best regards,

The Willow Team
+1 413 236 2980
ADCM, LLC dba Willow does not provide tax, legal, or accounting advice. This material has been prepared for informational purposes only, and is not intended to provide, and should not be relied on for, tax, legal or accounting advice. You should consult your own tax, legal and accounting advisors before engaging in any transaction. Although the information contained herein has been obtained from sources believed to be reliable, its accuracy and completeness cannot be guaranteed.  Neither the information nor any opinion expressed herein constitutes an offer or a solicitation of an offer to buy or sell securities.  

Willow Risk Monitor – June 2020

Willow Risk Monitor June 2020

Dear Clients & friends –

We are kicking off a new monthly newsletter where we share our current thoughts on markets and risk in an effort to provide some insight to our thinking, the metrics we pay attention to, and to lend some insight into what you are seeing and hearing in the news. We hope you enjoy, and please let us know if there is anything you would like us to go into more detail on, we welcome your feedback!

The numbers shown below are weighted averages and aggregates of the daily data we examine. They are used for illustrative purposes only. please see our disclaimers at the bottom of this email for more information or feel free to contact us directly.

Markets

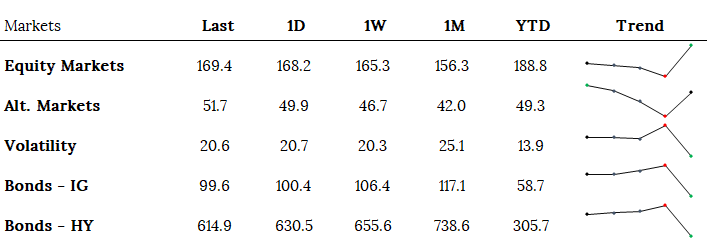
S&P 3000 is a key level for several reason – it’s a psychological level (who doesn’t love round numbers?), it’s right at the 200 day moving average (a key technical level), and it’s right above the 61.8% Fibonacci retracement level, which, with sustained pressure can typically signal a continued rally.  All in all, markets are about 40% off their March lows. Sounds great, right? But is it? With market breadth so slim, very few companies are participating in this rally. We stand firm by the thought that a violent drop would be accompanied by an equally violent rally – the question that remains – is this a “V” recover or simply the establishment of a “lower high” in a broader forming down trend that’s just starting to realizing the global economic disruption currently happening? That said, don’t discount the Fed, as the perception of back stopping any downside risk gets more and more believed a rally unhinged becomes a reality. But with millions unemployed, supply chains disrupted, and the future increasingly uncertain, do fundamentals mater anymore? Will they eventually catch up? That’s why we watch the data. 

Alternative markets like gold and bitcoin are looking decent. The former a traditional hedge, the later a potential alternative future, we believe strength in these markets could also be a proxy for faith in today’s equities markets. The fundamental case of limited supply assets vs. unlimited “whatever it takes” fiat will play out interestingly and possibly historically given current conditions – we’ll see.

While volatility has backed off considerably it remains are an elevated level, still over twice what it was at the beginning of the year. We would like to see these level much lower to really be confident in equity markets. But declining volatility metrics lessen the probability of continued large price swings.

Spreads across the board on both investment and high yield corporate bonds have tightened, same with credit default swaps. This is a positive sign signaling lower overall perceived risk in defaults. While levels are still elevated, they are moving in the right direction.

Risk Assessment:  Medium. Watch the technicals, participation levels, and volume – a select few companies can only drive markets so much higher before they lose their fuel. Cryptocurrencies in general are looking very interesting, and do not underestimate the influence of the Fed and central banks on markets. While there are some very apparent cracks in the building, the simple belief that the Fed will save us should anything happen will keep it standing… for now anyway.  

Economy

The consumer (~70% of the economy) continues to get beaten up as economic data continues to roll in. While most of this is expected, the numbers posting in many cases are never before seen. It took over a decade to build up as many jobs that were lost in a few months. It will be critical to see how this plays out and how quickly (or if) the measures of consumer health recover. Manufacturing (~11% of the economy) has experienced some relief recently as lock downs are being lifted but again some of these data points are screaming all is not well and are sitting at never before seen level.

Risk Assessment: Medium/High. While the data is bad, and that is expected, the speed and strength of how it resolves will be the determining factor for what comes next. Right now, this is a huge unknown. Remember markets and economy should be viewed as two very different entities.

Risk Metrics

Spreads versus US treasuries have for the most part tightened or are at least near levels they were at during the beginning of the year. This is generally a positive sign leaning toward some return to the perception of lower market risk. While liquidity has returned to markets compared to March levels, our signals are starting to show growing issues in this space, the numbers are not concerning yet but at this stage it’s worth noting and paying attention too.

Risk Assessment: Medium/Low. Most of our risk spreads have come in, which is positive, but remain elevated, not so positive. Cash and liquidity issues have been reined in but it does not look like we are out of the woods yet.

As always, be well and please feel free to reach out with any questions, comments, or concerns.

Best regards,

The Willow Team
+1 413 236 2980


ADCM, LLC dba Willow does not provide tax, legal, or accounting advice. This material has been prepared for informational purposes only, and is not intended to provide, and should not be relied on for, tax, legal or accounting advice. You should consult your own tax, legal and accounting advisors before engaging in any transaction. Although the information contained herein has been obtained from sources believed to be reliable, its accuracy and completeness cannot be guaranteed.  Neither the information nor any opinion expressed herein constitutes an offer or a solicitation of an offer to buy or sell securities.