Willow Risk Monitor September 2020
Welcome to the September 2020 overview edition of the Willow Risk Monitor, where we share our analysis of the level of risk in the current market across a variety of metrics. We also explain our thinking on how we look at and assess overall market risk, and we will often highlight what the data shows compared to what you might be hearing in the news.
Please contact us if you have any questions or if there is something you’d like more detail about. We welcome your feedback!
To learn more about the premium version of the Willow Risk Monitor, click here.
Consumer Health (proprietary algorithm)
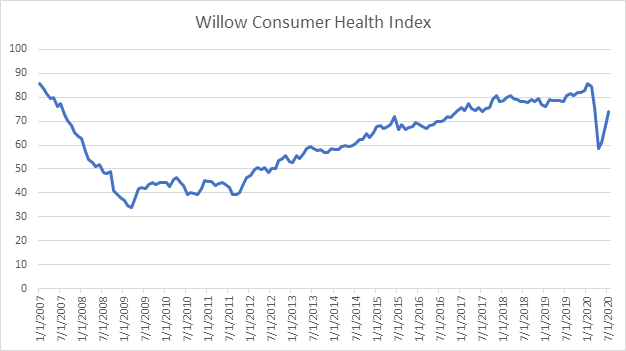

Our Consumer Health Index included several metrics focused on consumer sentiment and confidence, which have rebounded from their lows but have not yet been able to catch up to pre-COVID levels. While markets have a direct impact on consumer confidence, along with housing data (which for individuals out of cities has been fantastic), high levels of unemployment, wage stagnation, and uncertainty around the election and if a second COVID wave will materialize have continued to weigh this index down.
Manufacturing Health (proprietary algorithm)
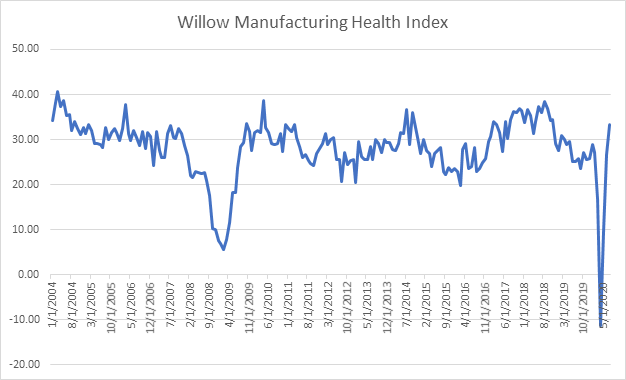
The rebound continues in the manufacturing space, and our indicators are showing a fast paced return to the mean. The degree of steepness in both drop and “recovery” makes sense when viewed through the lens that this was due to an intentional shut down of the economy and not due to outright structural issues (though those are still very much present) in manufacturing. Cost cutting, restructuring, increased automation all plays a role here. Overall, it is a positive sign, for now.
Market Volatility (proprietary algorithm)
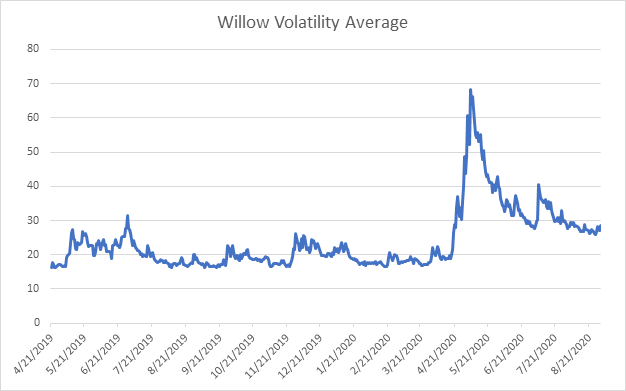

Our Willow Volatility Average examines several indices that track volatility, or the implied moves in asset prices over the next thirty days. Just recently this index has started to tick up. With the election looming, schools reopening, geopolitical tension rising, traders returning from vacation, and overall uncertainty on rise, especially around policy, it makes sense that this indicator would start flashing. While way off its March highs, our Volatility Average has been relatively flat for the past month but remains at a historically elevated level. The recent up-tick has us paying attention.
Credit Default Swaps
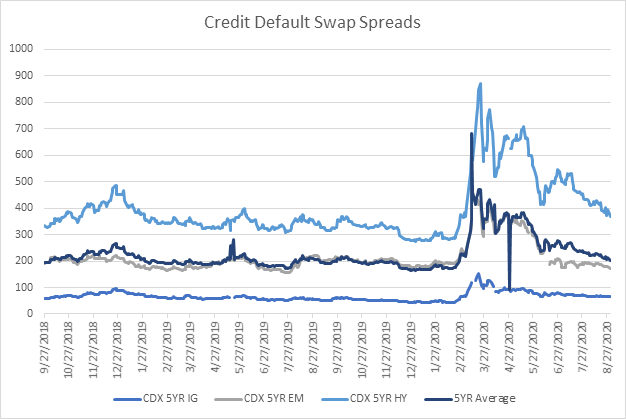
Credit default swap spreads have, for the most part, tightened back to pre-COVID levels which indicates markets believe the risk of defaults has come down considerably. High yield credit default swaps which shine a light on more riskier companies remains elevated still, but no where near its March peak.der the spread between it and its US Treasury counterpart. While overall most of these spreads have returned to pre-COVID levels, they still remain slightly elevated and may be starting to rise in some areas.
Bond Spreads
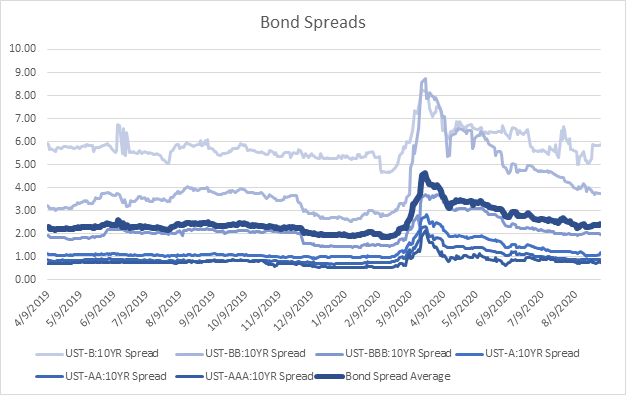

We look at bond spreads (the difference in interest rates between “risk free” or US Government bonds and different grades of corporate bonds) to show us how markets are gauging risk in lending to corporations. The riskier a bond is the wider the spread between it and its US Treasury counterpart. While overall most of these spreads have returned to pre-COVID levels, they still remain slightly elevated and may be starting to rise in some areas.
As always, be well and please feel free to reach out with any questions, comments or concerns.
Best regards,
The Willow Team
+1 413 236 2980
ADCM, LLC dba Willow does not provide tax, legal, or accounting advice. This material has been prepared for informational purposes only, and is not intended to provide, and should not be relied on for, tax, legal or accounting advice. You should consult your own tax, legal and accounting advisors before engaging in any transaction. Although the information contained herein has been obtained from sources believed to be reliable, its accuracy and completeness cannot be guaranteed. Neither the information nor any opinion expressed herein constitutes an offer or a solicitation of an offer to buy or sell securities.
